Vision-based Accident Anticipation
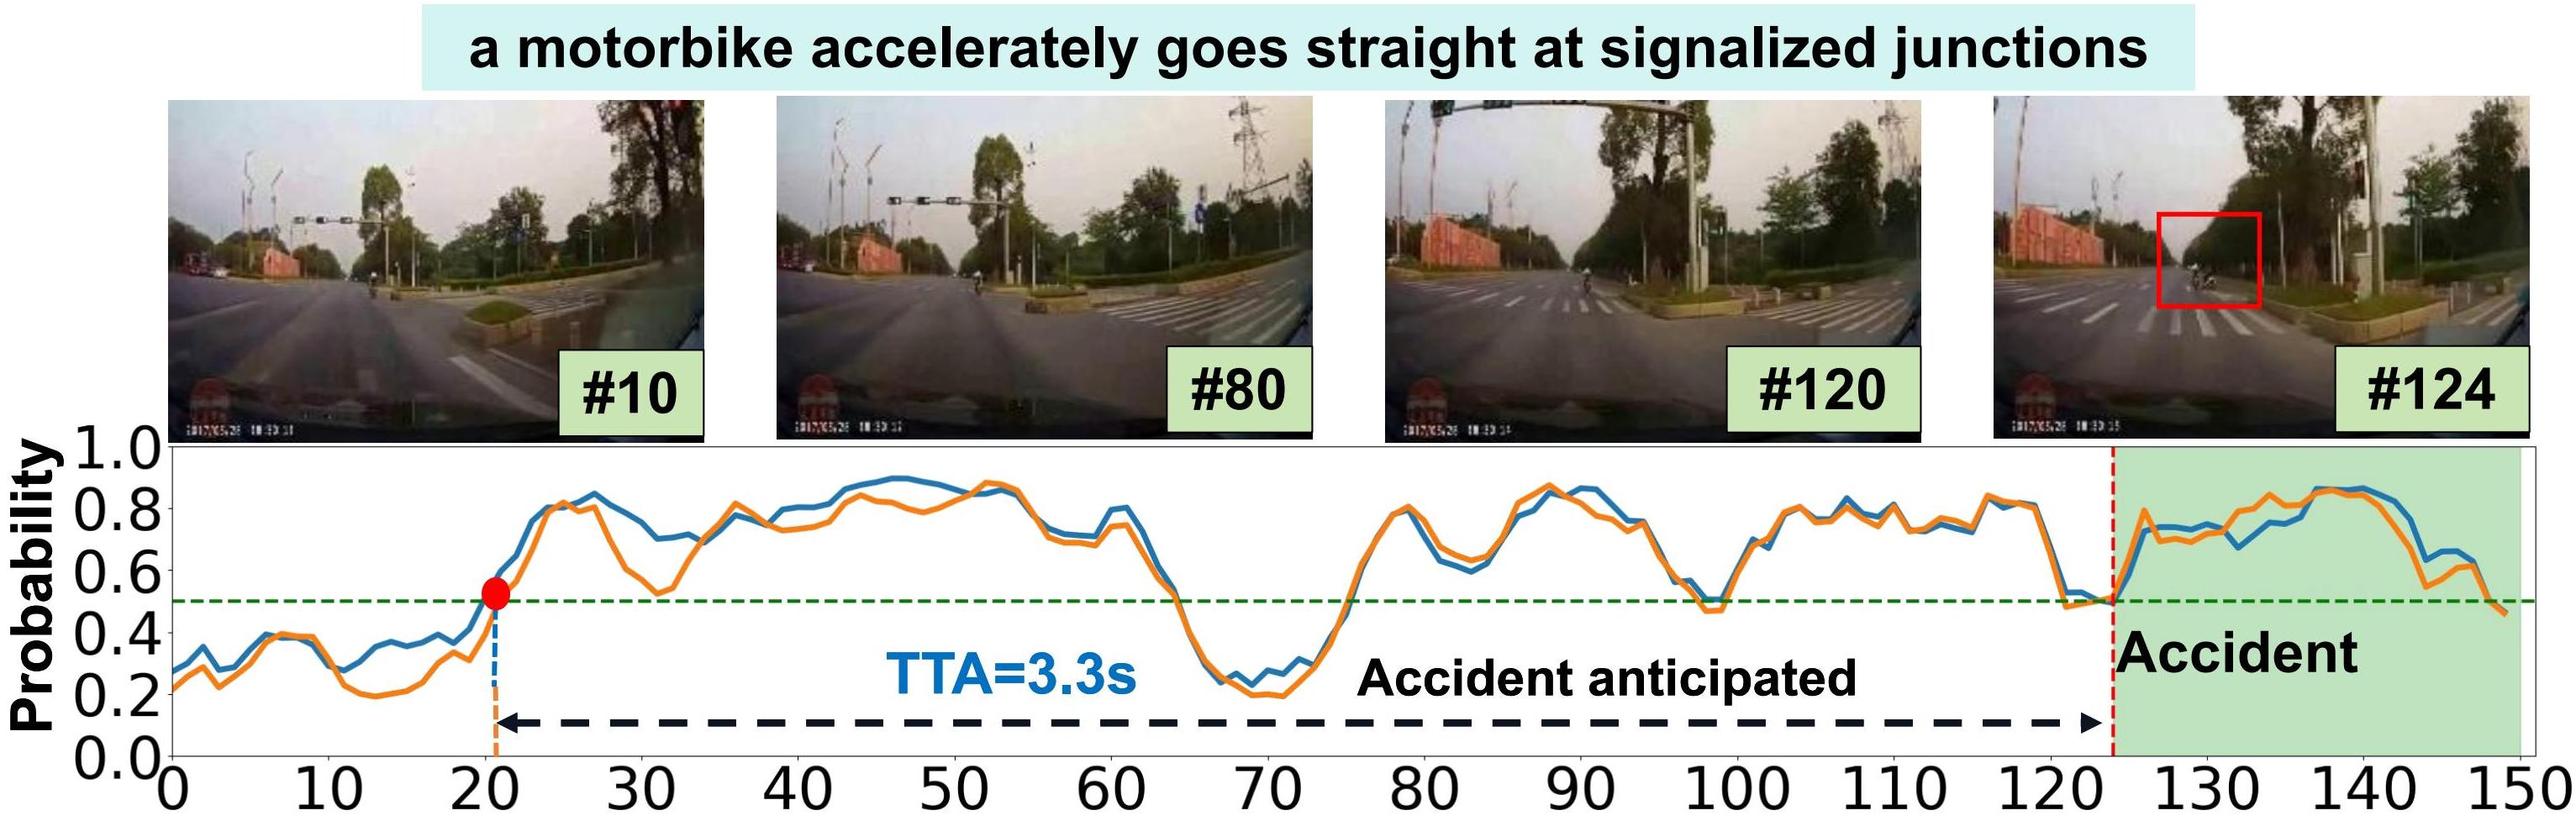
This is our vision-based traffic accident anticipation benchmark; we calculate the Average Precision (AP), Area Under Curves (AUC), mean Time To Accident (mTTA), and mean Time To Accident at 0.5 threshold (TTA0.5) values.
Leaderboard
| ID | Method | Year | Code | AP | AUC | mTTA | TTA0.5 | Environment |
|---|---|---|---|---|---|---|---|---|
| 1 | DRIVE | 2021 | Link | 69.0 % | 72.7 % | 3.657 | 4.259 | RTX 3090 |
| 2 | CAP | 2022 | Link | 74.4 % | 83.3 % | 4.020 | 4.497 | RTX 3090 |
| 3 | XAI | 2022 | Link | 89.0 % | 0.47 % | 3.550 | 3.723 | - |
| 4 | EQ-TAA | 2025 | Link | 71.0 % | 51.0 % | 3.510 | 3.909 | - |
| 5 | MsFIN | 2022 | Link | 86.0 % | 79.0 % | 4.172 | 4.630 | - |
| 6 | VideoMAEv2+Bert | 2022 | Link | 91.0 % | 80.0 % | 4.167 | 4.815 | - |
Submit Your Results
You can submit your metric values via the provided form. Furthermore, we would highly appreciate your contribution with clear links to relevant articles and code for more in-depth analysis.
Click here to submit your results:
Submit